Have you ever heard someone say “I won’t take less than a 12% return” or something like it?
Of course, you have, because it’s pretty standard practice in real estate to do that.
If you’re doing that… You’re wrong.
That’s a pretty strong statement for me to make, but let me explain why…
Risk-Adjusted Returns in Real Estate
You see, all the gurus teach you to do exactly that. They say, pick a return, analyze deals, find deals that meet that return.
If you have to buy a D class property in a war zone to reach that number, so be it.
But, would you rather get that 15% cash on cash return in a D class area or in a B class area?
The answer is obvious. For the same return, you’d rather be in the nicer neighborhood.
Why?…
Because intuitively you understand that higher class areas carry less risk. So for the same income, you’ll take less risk.
Now, would you take a 14% return in a B class or a 15% return in a D Class area?
Personally, I’d probably take the 14%. But, you see the point.
You need to adjust the returns based on the risk before making a decision to buy.
Definition of Risk Adjusted Returns
Risk adjusted returns refine the rate of return for an investment by measuring how much risk is involved with a particular investment. Generally, it is used in securities markets but can be applied to other markets, such as real estate.
Basics of Risk and Return in Real Estate
First, let’s take a look at a simple graph.
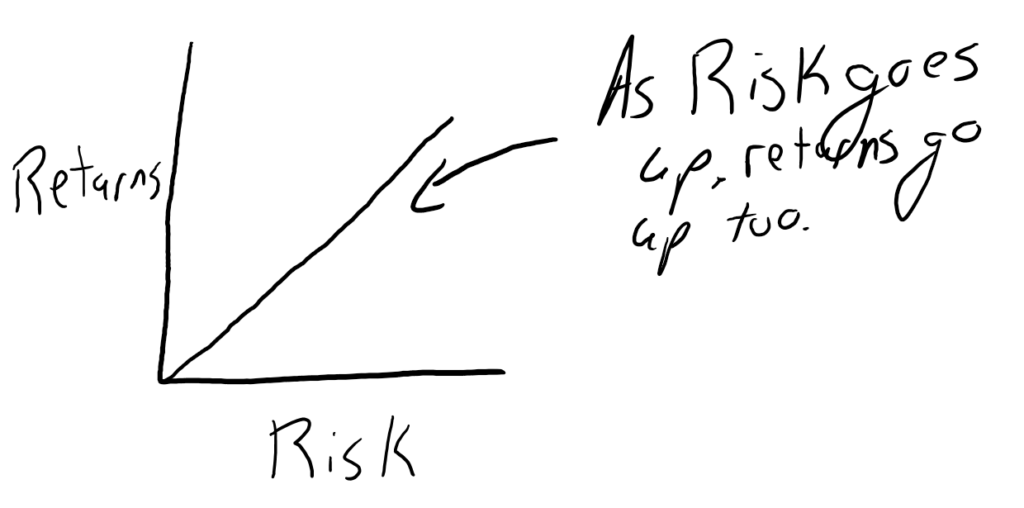
This is a simple representation of the market, where you can accept more risk and get a higher return.
Realistically, the graph wouldn’t be perfectly linear, but for the basic theory, it’s fine.
Now, let’s take it a step further.
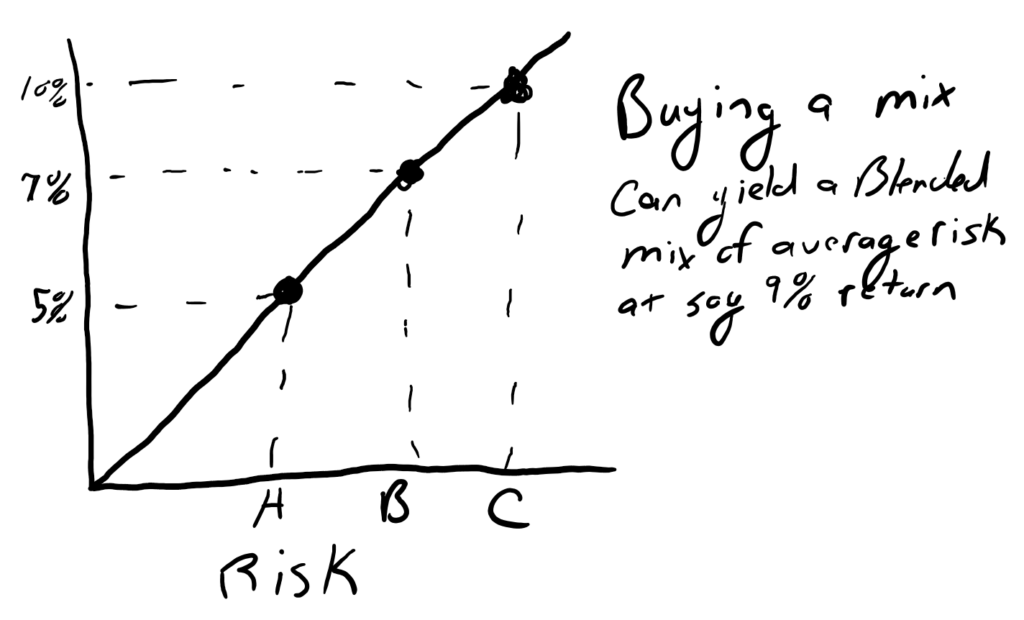
In my theoretical world, you can buy an A class property and get a very low return but only 5% return. B class property yields 7% and Class C property get’s 10%.
A person with a good allocation might be able to yield an 8% or 9% with an average amount of risk by mixing their assets between A, B, and C class property.
Sure, you could get 10% or more by only purchasing the riskiest assets, but you’ll also be the most likely to lose a lot during the next recession.
On the other hand, you could buy the safest assets and get a very low yield, but you’re leaving a lot on the table by not accepting even just a little risk.
Alright, this is pretty straightforward so far, now let’s take it a step further.
Setting Return Expectations
You come up to me and say, “Eric, I only want a deal that gets me 15% or more.”
OK, challenge accepted. I rush out and find an amazing deal that will get you 15%, meeting your expectations. Take a look:
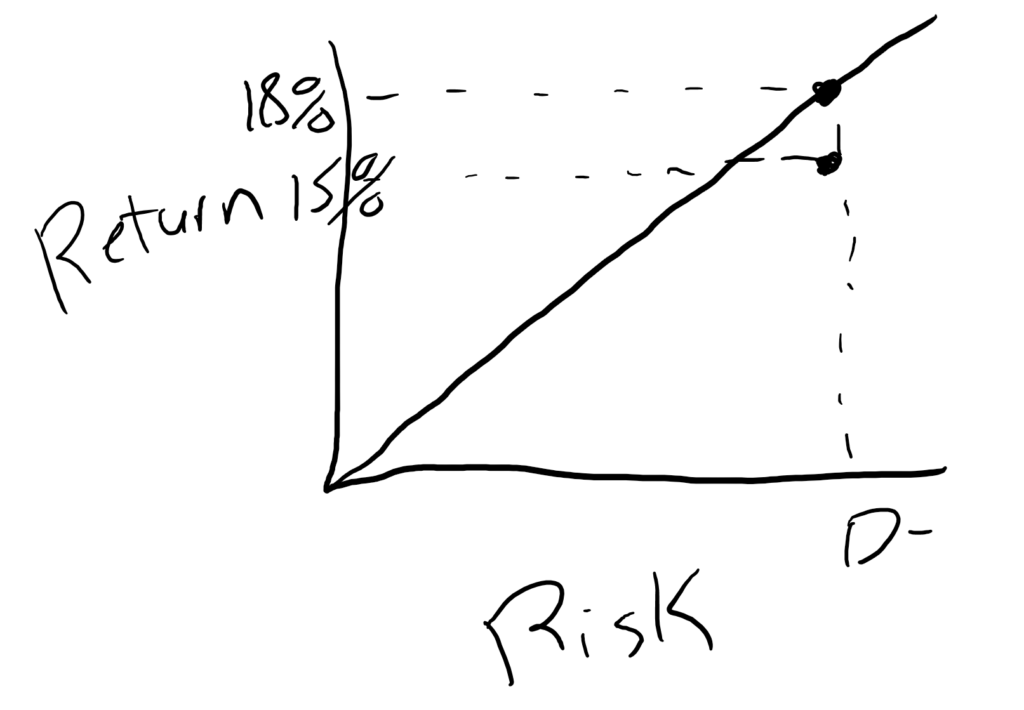
It’s an awesome property… Well, sort of.
I beat your expectations, but as you can see, this property is actually returning less than what other properties in its same class return. Another way to look at it is to say you could get a higher class property for the same return.
So, by setting an arbitrary expectation of returns, you could be completely destroying your portfolio.
Let’s take another example:
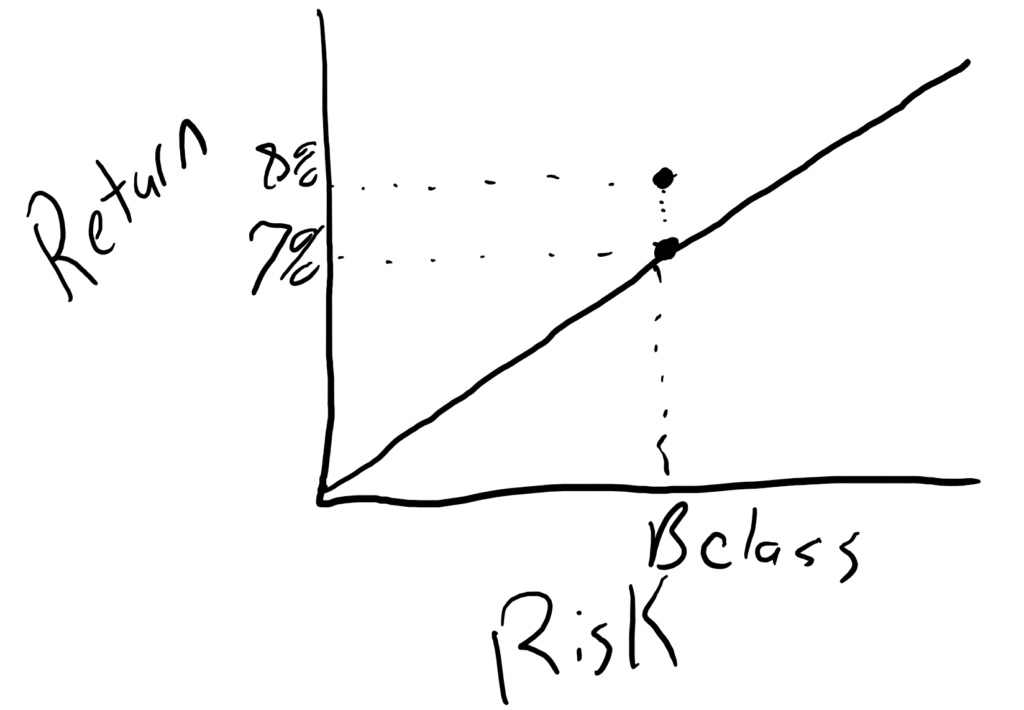
Here you can see that the returns are a bit higher than what similar properties in the same class are yielding.
But, once again, if you had set an arbitrary return expectation, you would be passing up an opportunity to significantly reduce the risk of your overall portfolio and keep your returns high.
Adjusting Portfolio Strategy For Changing Market Conditions
Another major thing to consider is how the economy will affect your overall strategy.
We all know that generally, as the economy goes down, there are more opportunities to earn money (but less capital available to take advantage of those opportunities). The reverse is true – when the economy gets hot, everyone chases deals and returns shrink.
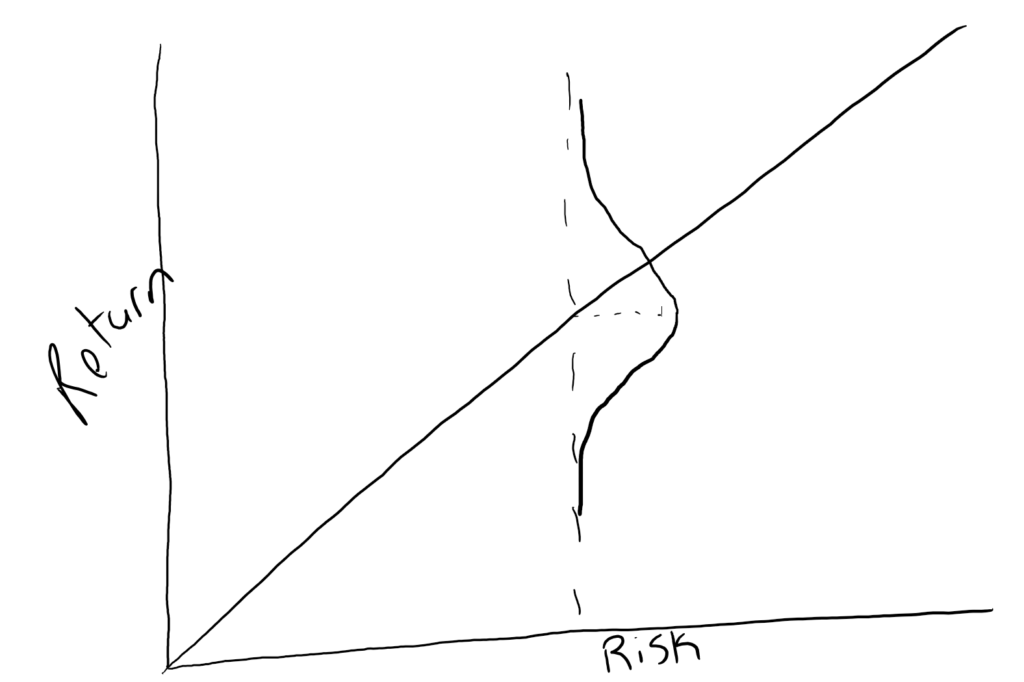
So, let’s start with a basic risk/return curve and overlay a normal distribution aka the bell curve. It just means that the majority of deals are going to be around the risk/return line and there will be some really bad deals and some really good deals out there. There are few really awesome deals out there, but there are some.
Now, let’s look what happens when the economy gets hot:
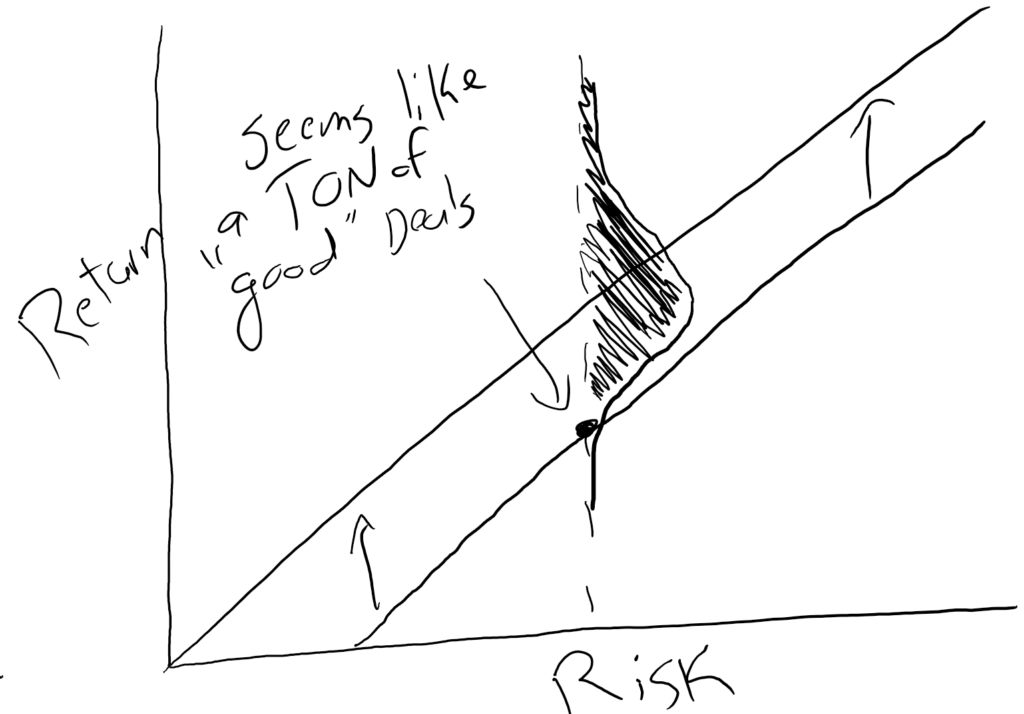
The line has moved up because now deals, in general, get more return for the same amount of risk.
…and what happens if you don’t adjust your return expectations? There feels like there are a TON of good deals.
I’ve shaded in the portion of the curve you’d consider “good” deals. Before, maybe half of the deals were potentially good, but now maybe 80% of deals are potentially good.
The opposite is true when the economy gets super hot:
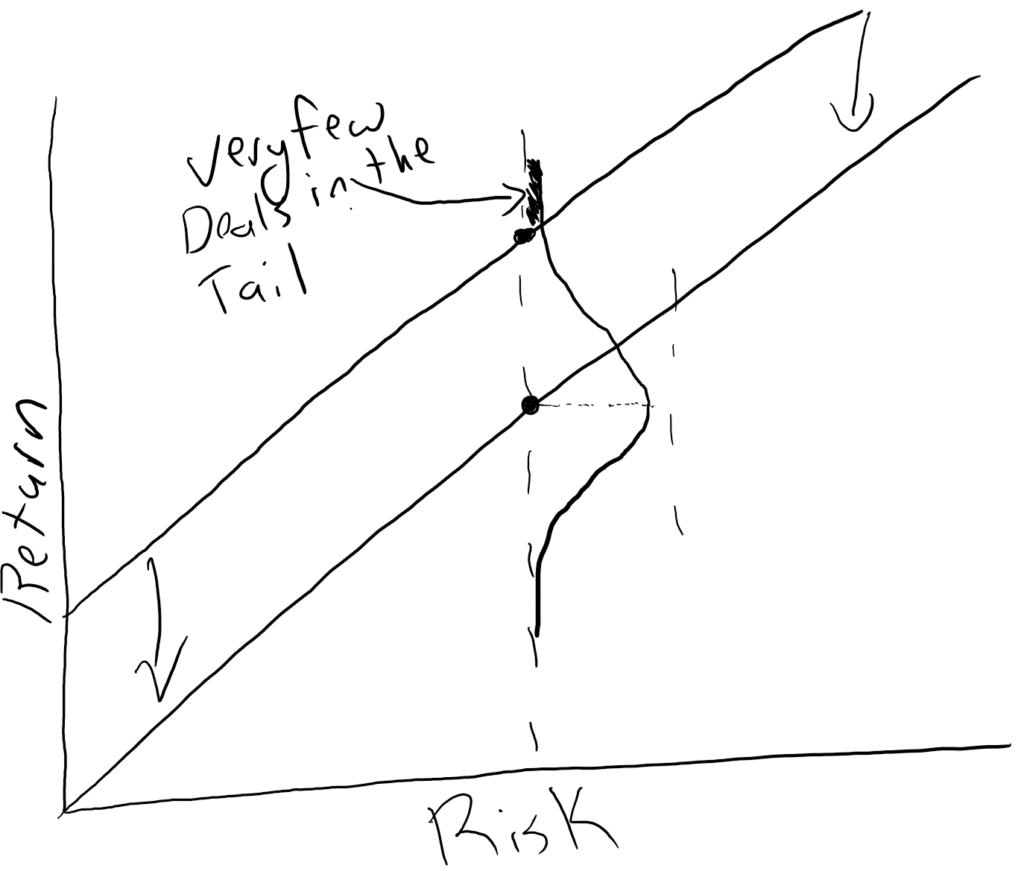
Now, you can see almost no deals meet your requirements. The shaded-in portion at the top shows only a few deals will make sense now.
Because the economy is hot, everyone wants to buy and are willing to accept lower returns in order to buy. If you keep your expectations the same, you’ll have no deals to buy.
That’s exactly what’s happening in 2018 with the real estate market:
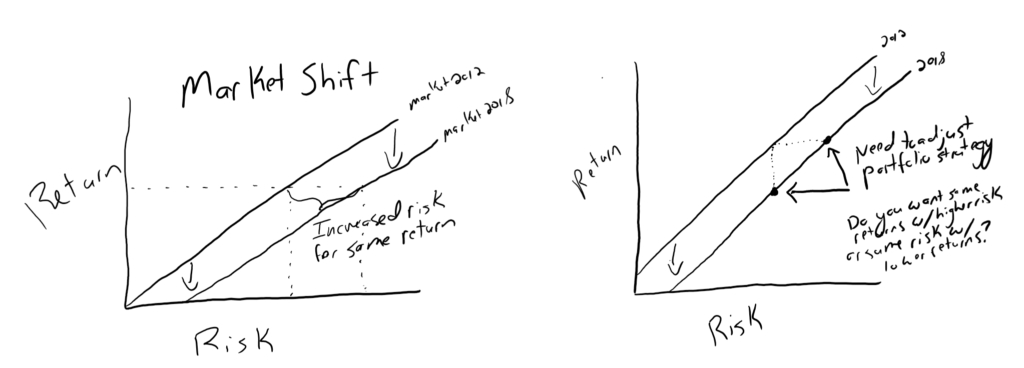
As you can see, the market has shifted down since 2012. So, to get the same return you need to accept more and more risk.
While there will be some deals that meet the old criteria, as the bell curve showed, eventually it will become nearly impossible to find a good deal. So, investors with a static set of criteria will find them ‘chasing yield’ to lower quality investments.
And I’ve seen this play out over the last year or two. To get the same yield, I see investors moving to worse and worse sections of cities or moving further and further away from core markets.
Both strategies are ways of accepting higher risk.
On the other hand, investors could accept lower returns and keep their risk the same.
While both strategies are fine, doing one without doing the other is simply stacking your portfolio full of risky assets without any lower risk assets to balance it out.
Major Risk Categories to Consider
There are probably dozens of different risks that you could categorize into any deal, but it would be impossible to rank every property for every risk, every single time you look at a deal.
Instead, we’ll cover a few of the core risks
Age
There is a useful life to everything. Even if a structure still has a lot of life left, many parts of that make the property ‘tick’ may be running out.
Roof, foundation, windows, plumbing, electrical, etc. It all has a shelf life.
The older a building is, the closer to the end of the useful life you’ll be for all of those items. The big risk is not knowing if, or when any of these items may go.
The plumbing may seem OK, but then a few years later you need to replace the entire sewer line underground.
So, even if the current owner has done a great job with maintenance and upgrades, older properties will always have more risk.
Market
This is something that is very local, but, in general, core markets are safer than secondary markets. Secondary markets are safer than tertiary markets.
Additionally, if you are looking at two properties in the same core market, you can look at the sub-market to compare risk. Two cities may be right next to each other in the same MSA, but one may be substantially different than the other.
Class of Property/Tenants/Area
In general, higher quality properties in higher quality areas are lower risk than very poor tenants in poor areas.
This isn’t always true, as sometimes recessions might hit affluent areas depending on the local market. So, adjust this based on your understanding of your market.
Leverage
Higher leverage = higher risk. If the market turns, there is less cushion to absorb the losses.
Additionally, with higher debt service, it takes a lot smaller of a dip in occupancy to cause a default.
Sponsor Experience
Whoever is the lead on the deal calls the shots. You want someone with more experience and a good reputation.
This isn’t saying you should never invest with someone with less experience, just make sure the returns are a bit higher to compensate for the additional risk, and make sure you have good voting rights in the partnership agreement.
Occupancy
Deals that have low occupancy will probably be cash flow negative at the beginning. This is accepting a lot of risk because if the property can’t be turned around quickly, it will go into default.
Further Adjusting Returns For Risk in Your Real Estate Deal
In reality, it’s impossible to simply know where exactly on the graph any property should be. Instead, it’s easier to compare two or more properties together and rank them.
There are a lot of ways to do this, and you can get as detailed as you want. For illustration purposes, I’ll keep it super simple.
Property 1:
- Built 1965
- 95% occupied
- Core market area
- C Class tenant base
- 80% leverage
- Sponsor experience – 7 years
- Target IRR 15%
Property 2:
- Built 1982
- 85% occupied
- Secondary market
- B Class tenant base
- 70% leverage
- Sponsor experience – 10 years
- Target IRR 13.5%
The next step would be to assign a ranking to each category based on the risk. You can assign each from 1-100, 1-10, or 1-5, it doesn’t really matter. To keep it simple, I’ll rank them from 1-5 with 5 being riskiest
Property 1:
- Age – 4 (Older properties have more unknowns)
- Occupancy – 1 (95% occupancy is very good)
- Market – 1 (Core markets tend to maintain value better than secondary markets)
- Tenant Base – 3 (Lower class tenant base has more risk)
- Leverage – 4 (Higher leverage means more likely to lose the asset during a downturn)
- Sponsor – 3 (Experienced but not an expert)
Total Risk Number – 16
Property 2:
- Age – 2
- Occupancy – 3
- Market – 3
- Tenant Base – 2
- Leverage – 2
- Sponsor – 2
Total Risk Number – 14
With these two assets, you can see that one has more risk, but also has more return. If you plotted them against each other:
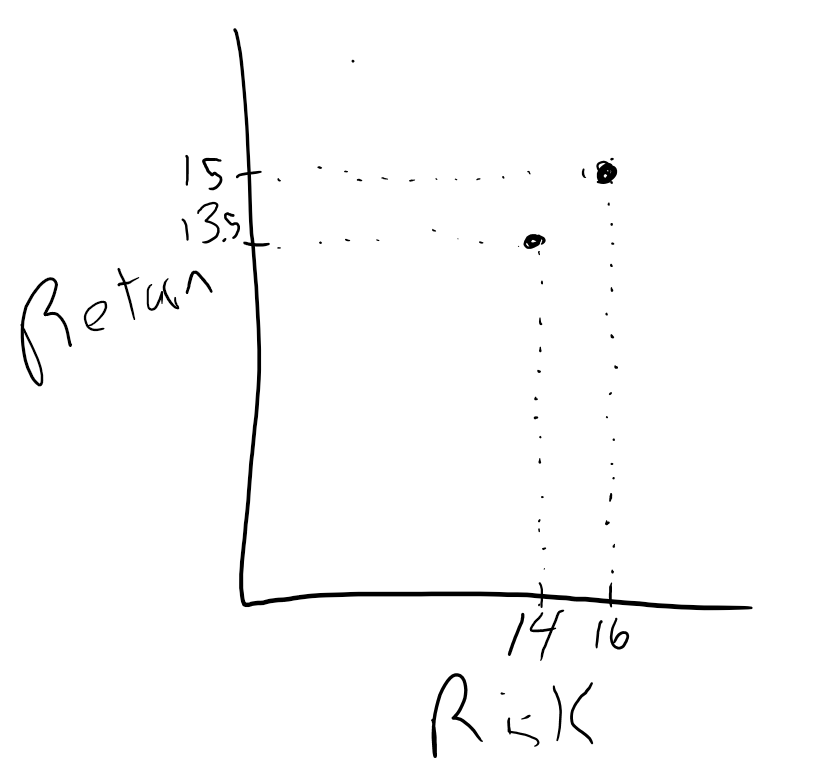
Another way to look at it is – in order to gain 1.5 percentage points more return, you accept 2 more points of risk.
Or… – You accept 14.3% more risk (2/14) to gain 11.1% more return (1.5/13.5).
Once you plot several properties onto a graph, you could slowly start to build out the real graph in your market. If you had hundreds of data points, your graph might look something like this:
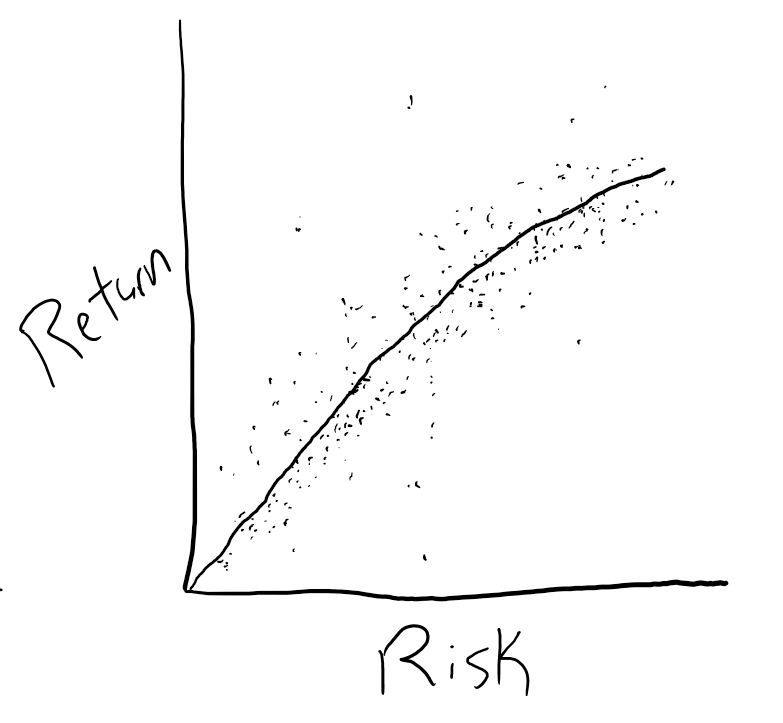
Since you probably won’t have that much data as a typical investor, it’s best to compare just the several deals you can look at and compare them to each other… because you can always compare two deals against each other.
Then, you just need to decide if the additional risk is worth the additional return, to you.
Conclusion – Normal Portfolio Theory and Recommendations Apply to Real Estate
Just like you wouldn’t load up your stock portfolio with a ton of high risk and very speculative companies, you wouldn’t want to do the same thing in real estate.
Unfortunately, especially over the last several years, people have got this feeling that all of real estate is the same and what matters is the bottom line number.
The reality is the total projected return is completely meaningless if you don’t adjust it for risk.
Eric Bowlin has 15 years of experience in the real estate industry and is a real estate investor, author, speaker, real estate agent, and coach. He focuses on multifamily, house flipping. and wholesaling and has owned over 470 units of multifamily.
Eric spends his time with his family, growing his businesses, diversifying his income, and teaching others how to achieve financial independence through real estate.
You may have seen Eric on Forbes, Bigger Pockets, Trulia, WiseBread, TheStreet, Inc, The Texan, Dallas Morning News, dozens of podcasts, and many others.

Thank you for sharing this kind of information, very helpful to everyone and has the best way to adjust to everyone.